


Product Life-Cycle Management using BCG Growth-Share Matrix
Here’s an interesting thought on using the BCG Growth-Share matrix as a product life-cycle management tool, with a tweaked representation…

Here’s an interesting thought on using the BCG Growth-Share matrix as a product life-cycle management tool, with a tweaked representation of relative opportunities for investment across your products. Hope the idea is relevant and useful.
The traditional product life-cycle curve will look like this:
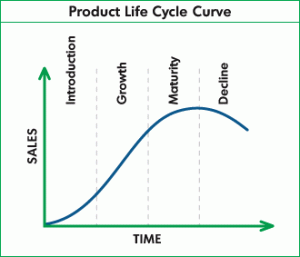
Through the years I’ve discovered a couple of limitations with this curve:
It doesn’t tell us when to invest in a product vs. when not to
It doesn’t tell us which product(s) to invest and which ones not to
Clearly I see two reasons for these limitations:
Lack of relative performance indicators of a product within your portfolio
Lack of relative performance indicators of your product(s) against your competitors’ products
I believe these two pieces of information are required to determine when to invest in a product and when not to, and in which products to invest and which ones not to.
A few years ago I bumped into Growth-Share Matrix, a 2×2 matrix from Boston Consulting Group, created for corporations to analyze their business-units / product-lines.

As many of us are aware, the BCG Growth-Share matrix has four quadrants to rank products on the basis of relative market share and market growth rate. The description of this matrix is widely available in the Internet.
Back to the product life-cycle management topic…
It is important to note that the BCG matrix helps us determine product priorities by classifying products based on their current value & position (as measured by market share) and future value & potential (as measured by market growth).
Also, the BCG matrix helps classify products into four categories based on competitive position (relative market share) and industry attractiveness (growth rate of that industry).
Accordingly, we could extrapolate the matrix to include sliding markets and declining market share — the graph which encompasses these additional attributes will tweak and look like this:
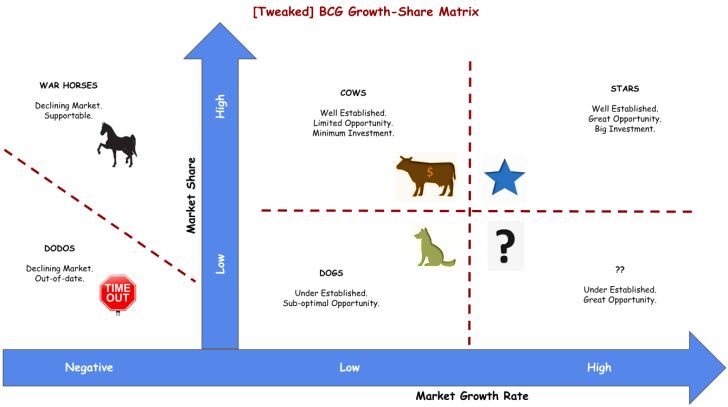
? (Question Marks): New and innovative products (in a growing market) normally start in the question mark quadrant. These are the future Stars and so continuous investment is required in growing the market share.
Stars: ? will evolve into Stars. Stars are in a rapidly growing market and such markets will attract new entrants posing heavy competition. So, Stars need to be groomed continuously to grow their market share at the same or at a faster pace than the market.
Cows: After a period of time, as determined by market forces and technology evolution, the market growth rate will flatten and at this stage if the product has a good market share then companies need to minimize their investments in Cows and use them to milk as much as possible. The cash/investments required to grow ? and Stars will be fueled mostly by the Cows.
War Horses: The Cows will eventually start to see declining market share because of the shrinking market growth, at which point the product is just supportable with near-zero cost.
Dodos: War Horses will eventually bite the dust and become Dodos at which point they are simply out of date and it’s better to retire the product.

Happy to hear what you think.
Best!