

BCG Matrix: what it is and how to use it in product strategy
The BCG Matrix is a framework widely used by technology companies for the management of digital products and for the definition of their…

The BCG Matrix is a framework widely used by technology companies for the management of digital products and for the definition of their Growth strategies .
Throughout this article, you will better understand what the BCG Matrix is , how this structure relates to the product life cycle , when this analysis should be done and how to do it in the context of product management .
What is BCG Matrix
The BCG Matrix (or Growth Share Matrix) is a visually appealing strategic tool created in the 1970s by Bruce Doolin Henderson, founder of the Boston Consulting Group . This framework aims to support companies in the management of their product portfolios , analyzing the market share and growth potential of their products.
Considering the life cycle of products, the methodology helps managers make the best decisions about keeping or removing an item from the portfolio, in addition to providing relevant data to support product or company positioning strategies .
The BCG Matrix also helps managers to have a global view of their portfolios , considering one product in relation to another, evaluating criteria such as sales volume, level of effort and monthly revenue.
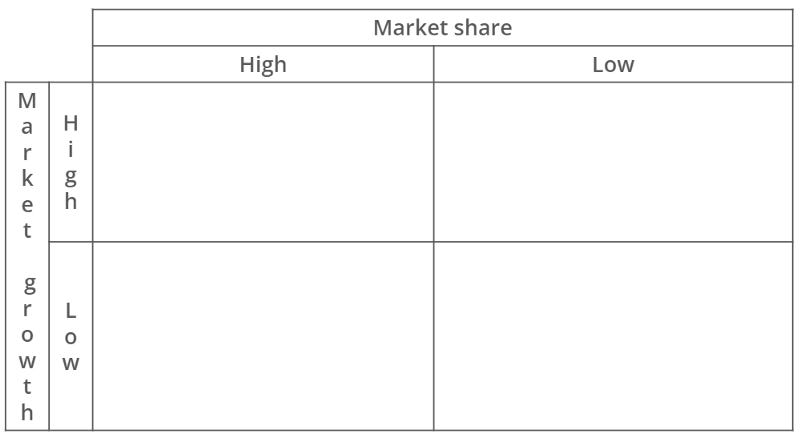
In terms of structure, the BCG Matrix is divided into 2 axes and 4 quadrants , as we will see next.
How the BCG Matrix works
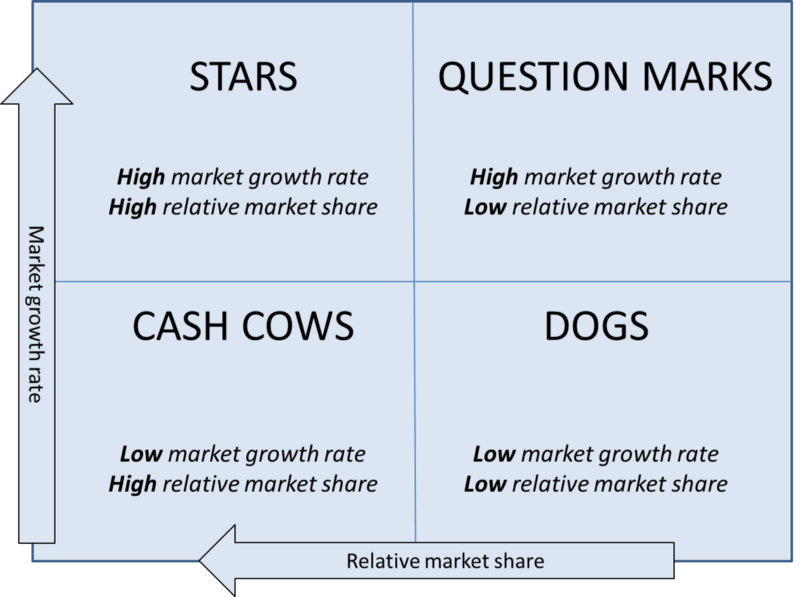
To make it clear how the BCG Matrix works, let’s explain each of the items that compose it. But we have already mentioned that it is articulated from a vertical axis , which indicates market growth, and a horizontal axis , which indicates the relative share of the product in the market.
The quadrants must be evaluated in relation to the axes, functioning as a combination between them. This image represents a BCG Matrix model for you to understand better:
Based on the portfolio analysis , the company must decide which quadrant each of its products is in , which will guide strategic decisions regarding the future of this catalog. Furthermore, the BCG Matrix is not a fixed structure , it changes over time, so that a product that today occupies a certain quadrant, later on, can fill another. Come find out more!
Axes
Vertical: market growth
The vertical axis corresponds to market growth (or market growth ), which can be classified as high or low. To understand this aspect, companies must look at the numbers of the segment in which the evaluated product falls. This is where market research, benchmarking and competitor analysis come in.
Horizontal: relative market share
The horizontal axis corresponds to relative market share (or market share ), which can also be classified as high or low. In this case, the company needs to evaluate the percentage that the product occupies in the segment in relation to competitors.
Quadrants
As we said, the BCG Matrix is divided into 4 quadrants , each corresponding to a category or moment in the product’s life cycle (introduction, growth, maturity and decline), which must be taken into account for the company to identify when this cycle finished and it’s time to take the product off the market.
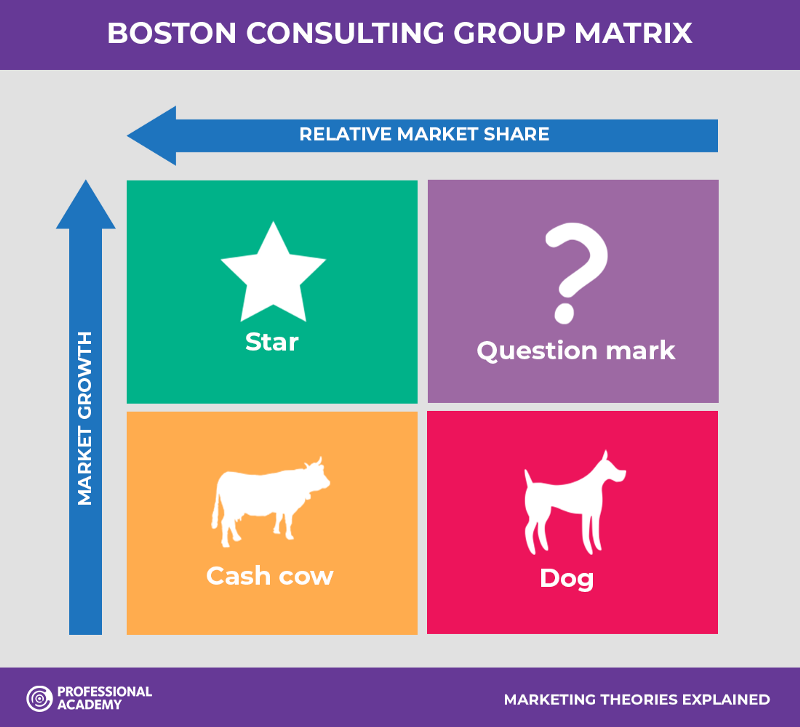
Question mark / Bet
This category corresponds to products that represent an unknown for the company , which is not sure about the performance of these items in the market. They are also often the newest products in the portfolio. These items may have potential and even an initial sales growth, but they still do not have a large market share.
Star
The star product is the company’s sales success , with an expressive market share that follows the growth of the sector.
Cash cow
The dairy cow product has already shown sales growth, but is going through a period of decline or stagnation , despite still having a significant market share.
Dog
This category covers products with a low market share and which show a decline or stagnation in sales . When identifying these items, the company should consider removing them from the catalog, because they could be bringing financial losses, with no return on the investment made.
BCG matrix and product life cycle
You can already understand that the BCG Matrix has everything to do with the product’s life cycle , which is nothing more than the time between the beginning of the product’s development until its withdrawal from the company’s portfolio, considering its time of activity.
In this sense, the BCG Matrix can be a very useful tool for portfolio management , as it allows identifying the financial return of each product and observing whether the catalog items are following market updates. Based on this analysis, the product team can assess the need to change strategies and the composition of the portfolio , identifying the best moment to make the changes.
When to use the BCG analysis
BCG analysis can be performed in different contexts within the Product area and should be seen as a strategic framework to be revisited with some frequency , considering the dynamism of the market. We separate some situations in which the Matrix can be applied by the team in their portfolio analysis:
Analyze the feasibility and necessity of launching a new product;
Conquer a new market or expand the company’s share in a certain segment;
When a product is bringing losses or going through a significant drop in sales and popularity with the public;
Important change in the company’s segment;
When the technology used in the product becomes obsolete;
If the company has created a new version of an old product and needs to assess whether it is worth keeping both of them up and running;
To keep the portfolio healthy and analyze the performance of your catalog;
Understand the level of user engagement with products and refine retention strategies.
These are just a few examples of how the Product team can use the BCG Matrix . Now, the most important thing is to understand how to apply analytics to your strategy. Come and see!
How to do BCG analysis of your products
Check out a step-by-step guide to perform a BCG analysis and make a more efficient portfolio management!
1. List the products
The first step in building the BCG Matrix is to list all the company’s products to be clear about what will be evaluated. The idea is that the analysis considers and compares the items, so it is important not to leave any of them out. In this list, you can bring a little more context and categorize products according to type, for example.
2. Define the purpose of the analysis
Then, it is essential to define the objective of applying the method to your product portfolio . After all, keeping this in mind will help guide your analysis. Is the team’s goal to understand if there is room for a new product? Assess the feasibility of a launch? Maintain or update the catalog more efficiently? Get the team together to discuss the possibilities and reverberations of using the matrix.
3. Establish the criteria
What criteria will the team use to categorize products according to the axes and quadrants of the BCG Matrix? When to consider that a star product has become a dairy cow? To answer this type of questioning, it is important to establish some analysis guidelines . To do this, think about the expected growth percentage for each new product and what market share you want to achieve with each item.
Measuring these results, it is easier to make decisions about whether or not to keep a product in your catalog , for example. For this, it is very important to consult market studies on your segment, because without these references, companies, especially the most innovative, can make mistakes that will compromise the entire course of the business.
4. Analyze the data
In addition to establishing the criteria that will be considered when completing the BCG Matrix, you must collect and analyze data about your product , your competitors and the market in general.
Some practices to adopt at this stage are:
measure and compare the growth percentage of each product
calculate the market share of each product (dividing the sales revenue by the total market)
Evaluate how each item compares to the competition
use market research to understand the industry’s growth rate
look at product data (like engagement and session time) to identify usage trends for each product
find out how much each product sold relative to your own portfolio and the competition
pay attention to sudden changes in the market that may represent an increase or decrease in sales
The idea here is to evaluate the data to categorize the products according to the quadrants and axes of the BCG model and fill in the matrix.
5. Distribute the products across the matrix
Now that you have the criteria and data analysis in place, it’s time to distribute your products across the matrix . Draw the tool structure and include each item in the corresponding category. To demarcate differences between items in the same category, you can use icons of different sizes or colors that indicate the expressiveness of the product in the company’s revenue.
Also, after assembling and evaluating the matrix, set a time to review and re-analyze, as the products organize themselves in a dynamic way.
How to use the BCG Matrix in product strategy
With the BCG analysis ready, what to do? How can teams use the insights generated by this framework to improve their product strategy and reap better results?
We talked about the importance of setting a goal before starting to fill in the BCG Matrix. In this sense, the actions of the team after building the model must be linked precisely to that initial objective.
But, in general, the matrix guides Product professionals in decisions about portfolio management. So, here are some paths you can take with the insights gained:
Build: By looking at the data, the team can decide to optimize or launch a particular product with the aim of driving market share;
Maintain: Another way out that the team can find is to maintain market share of a dairy product, which brings profits to the business, despite not experiencing a rise in sales. This product category helps to maintain the company’s revenue, because it already has a consolidated and loyal audience;
Reap: the third option is to improve the company’s cash flow (in the sense of “harvesting” profits) in a short period of time, without looking at the long-term developments. In this case, the team chooses to invest in products that do not have as much growth potential (such as falling dairy cows and pineapples), but that bring in revenue;
Abandon: the fourth alternative is to withdraw a particular product from the catalog, based on the assessment that the item is demanding a great effort from the team or a high financial investment and is not bringing the corresponding return. The objective with this is to reduce costs and relieve the team, opening the possibility of investing in other fronts.
These 4 outputs are usually associated with the BCG Matrix when we talk about portfolio management.
But Product teams can still use the information gathered in the model building process to :
Gain buy-in from stakeholders (if the team has verified, for example, that a product is pineapple, it can create a data-based presentation for stakeholders to convince them of the need to remove the item from the portfolio);
Convince the team about a strategy or initiative (the product may be the team’s favorite, but not bring the expected return or even slow the company’s long-term growth; the data obtained can help decide to withdraw the item from the portfolio);
Make decisions based on data and not on intuition;
Find competitive advantages over the competition and market gaps for the development of a new product;
Deepen knowledge about your product portfolio, increasing your room for manoeuvre;
Define Product Marketing strategies and change or test the positioning of a product.
As we have seen, the BCG Matrix is one of the essential tools for product management.